Working with dates

A lot of people get confused when working with dates. But they're really rather simple when you get to know them.

All dates and times are stored as numbers, the unit being days. Specifically, they're stored as the number of days since 1 January 1900. (There's a slight quirk that means that Excel counts one day too many, but that's not important right now.)

Today, 1 June 2011, is stored as 40,695. That's 40,695 days since the start of the last century. If you simply input a date, it will store it as the beginning of that day, or 00:00:00. If you want to reference midday on that day, you simply add 0.5 (half a day). And you can add any unit of time simply by adding it (in days) to the number of the date you're referring to.

So 2019 (19 minutes past eight in the evening) today is stored as 40695.846528 (or 40695 + 1219/1440 (1219 minutes gone out of 1440 in the day).

Even when you see a time displayed without a date, it always has a date associated with it. It's only its display settings that prevents it from being shown.

So if you want to add 12 hours to a timestamp, add 0.5. If you want to add three days and three minutes, add 3+3/1440. Excel will do the calculations and your display settings will show your time and dates accurate to the second. Job done.

A word of warning: take care when working across geographies. American dates are displayed as MM/DD/YYYY, whereas British ones are displayed as DD/MM/YYYY. Whenever there's a risk of confusion, display your dates with the month written out as a word or an abbvreviated word. This will ensure that people are happy when you produce that deliverable by 11 December, and that no one expected it on 12 November.

MAX

Summary

MAX brings back the maximum value from a range of cells. As with other similar functions, it ignores any cells containing text or logical values

As with SUM, it only applies to cells that are formatted as numeric values (including dates, percentages etc. as well as your bog-standard numbers). But if you try to do a maximum across a range that includes some cells containing non-numeric values, it will still work. It will simply ignore those cells in performing its calculation.

If the cells in your range contain the values 1, 2, 3, Y and 4, then the function will return the value 4, the maximum of 1, 2, 3 and 4. The Y will be ignored. Blank cells will be similarly ignored. Similarly, the formula will ignore logical values (i.e. those that contain a TRUE/FALSE value). But cells containing a zero will count towards the calculation. So if the cells in your range contain the values -1, -2, -3, 0, -4, the formula will return the value 0.

Syntax

=MAX(Range)

Range can be made up of a single range or a set of distinct ranges. If you're using a set of distinct ranges, they should be separated with commas.

Examples

=MAX(A1:Q20): this will bring back the highest numeric value between columns A and Q, in rows 1 through 20

=MAX(A1,C5,D12,D15:D20): this will bring back the highest numeric value in the ranges specified

COUNT

Summary

COUNT is not as straightforward as it might look. Many people think it counts the number of cells in a range, or the number of populated cells. But it doesn't. Instead, it counts the number of cells in a range that contain a numeric value. This will include dates, percentages etc. as well as your bog-standard numbers.

If the cells in your range contain the values 1, 2, 3, Y and 4, then the function will return the value 4, ignoring the Y. Blank cells will be similarly ignored. Similarly, it will ignore logical values (i.e. those that contain a TRUE/FALSE value). But cells containing a zero will be included in the count.

Syntax

=COUNT(Range)

Range can be made up of a single range or a set of distinct ranges. If you're using a set of distinct ranges, they should be separated with commas.

Examples

=COUNT(A1:Q20): this will count the number of numeric cells between columns A and Q, in rows 1 through 20

=COUNT(A1,C5,D12,D15:D20): this will count the number of numeric cells the ranges specified

AVERAGE

Summary

AVERAGE takes some legwork out of formula creation. It adds up some numeric cells and then divides this by the number of cells it added up. In mathematical jargon, it provides the arithmetic mean of a set of cells.

As with SUM, it only applies to cells that are formatted as numeric values (including dates, percentages etc. as well as your bog-standard numbers). But if you try to do an average across a range that includes some cells containing non-numeric values, it will still work. It will simply ignore those cells in performing its calculation. Similarly, it will ignore logical values (i.e. those that contain a TRUE/FALSE value).

If the cells in your range contain the values 1, 2, 3, Y and 4, then the function will return the value 2.5, calculated as (1+2+3+4)/4. The Y will be ignored both in the sum and the divisor. Blank cells will be similarly ignored. But cells containing a zero will count towards the calculation. So if the cells in your range contain the values 1, 2, 3, 0, 4, the formula will return the value 2, or (1+2+3+0+4)/5.

Syntax

=AVERAGE(Range)

Range can be made up of a single range or a set of distinct ranges. If you're using a set of distinct ranges, they should be separated with commas.

Examples

=AVERAGE(A1:Q20): this will take an average of everything between columns A and Q, in rows 1 through 20

=AVERAGE(A1,C5,D12,D15:D20): this will take an average of the ranges specified


SUM

Summary

SUM is probably the most regularly used formula. It does exactly what it says on the tin. It adds things up.

It only applies to cells that are formatted as numeric values (including dates, percentages etc. as well as your bog-standard numbers). But if you sum a range that includes some cells containing non-numeric values, it will still work. It will simply ignore those cells in performing its calculation. Similarly, it will ignore logical values (i.e. those that contain a TRUE/FALSE value).

Syntax

=SUM(Range)

Range can be made up of a single range or a set of distinct ranges. If you're using a set of distinct ranges, they should be separated with commas.

Examples

=SUM(A1:Q20): this will SUM everything between columns A and Q, in rows 1 through 20

=SUM(A1,C5,D12,D15:D20): this will sum the ranges specified

How to construct formulae in Excel

Formulae are created by combining up to six types of object:

  • operator
  • condition
  • value or reference
  • range
  • informational
  • logic helper

Each will be described in detail here. The subsequent formula descriptions will refer back to these, so it’s important that you understand each of them before moving on to the formula descriptions.

Operator

This is the formula itself. It tells Excel what it’s meant to be doing. An opening round bracket ( comes straight after the operator. A closing round bracket ) signifies the end of the formula. The IF in the formula below represents the operator.

=IF(CONDITION,VALUE1,VALUE2)

Condition

This is a test that is deemed either true or false. Excel interprets conditions as having a value of TRUE or FALSE and bases additional logic on which value it is. Below are some examples of conditions.

  • A1>B1: If cell A1 is greater than cell B1 then it’s true
  • A1=B1: If cells A1 and B1 contain exactly the same value, then it’s true. Note that for text-based comparisons, case doesn't matter. So "LONDON" is considered to be equal to "London" and "LoNdOn"
  • A1<>B1: If cell A1 contains a different value to B1, then it’s true
  • ISBLANK(A1): If cell A1 is blank, then it’s true
  • A1+B1=C1: If the sum of A1 and B1 is equal to C1, then it’s true
  • MAX(C:C)>4: If column C contains a value greater than 4, then it’s true

Value

This is either a cell reference, a number or text. Examples include

  • A1
  • "New York"
  • A1+B1
  • 45

But because every formula returns a value, the value/reference could itself be a formula—a formula within a formula. So the following formulae can also be considered values

  • MAX(A1,B1,C1). This will give the value of the maximum of the three cells
  • IF(A1=2,3,4). If cell A1 is equal to 2, this will give the value 3; otherwise it will give the value 4
  • VLOOKUP(A1,$C:$E,3,0). This will look up cell A1 in column C and bring back the equivalent value in column E

Range

A range of cells is used in formulae that need to reference groups of cells. A range is always referenced by giving the cell at the top left of the range followed by the cell at the bottom right of the range. These two entries are separated with a colon to signify that a range is being referenced. Ranges always sit within a single sheet.

Examples include:

  • A1:A10: the first ten cells of column A
  • A1:M1: the first 13 cells of row 1
  • A1:M10: the 10 rows and 13 columns bound by columns A and M, and rows 1 and 10

In rare examples, a range can be defined by a list of cells, separated by commas:

  • A1,A2,A5,A10.

Informational

An informational argument checks the contents of another cell and returns the value TRUE (1) or FALSE (0) based on what it contains. Examples include:

  • ISBLANK(A1): checks whether cell A1 is blank
  • ISNA(A1): checks whether cell A1 contains the “#N/A” value (a type of error)
  • ISODD(A1): checks whether cell A1 is odd

Logic aides

As their name suggests, logic aides are there to help with logic in conditions. There are three that are regularly used that are worth knowing: AND, OR and NOT. When used, they act like a condition, but it’s worth discussing them specifically.

  • AND: this is used to check whether multiple conditions are all true
  • Example: AND(A1=A2,B1=B2,C1=C2). If A1=A2, B1=B2 and C1=C2, then this condition will be considered true; otherwise it will be considered false.


  • OR: this is used to check whether any one or more of a set of conditions is true
  • Example: OR(A1=A2,B1=B2,C1=C2). If A1=A2 or B1=B2 or C1=C2, then this condition will be considered true; otherwise it will be considered false. If more than one of the conditions is true, then it is considered true


  • NOT: this is used to reference the opposite of a condition. It’s often useful to combine this with AND or OR functions to get what you’re looking for
  • Example: NOT(A1=A2). If A1 is not equal to A2, then this condition will be considered true
  • EXAMPLE: NOT(OR(A1=A2,B1=B2,C1=C2)). If any of the conditions are true, then it will be considered false

Using dollars in cell references

Dollars are inserted into cell references to influence what happens when that cell reference is copied from one cell to another. It only affects behaviour when the cell reference is copied and pasted elsewhere. It does not have any effect if the cell reference is cut and pasted.

A dollar can be inserted before either the column letter or the row number (or both). The dollar fixes that bit of the cell reference (either the row or the column). So the dollar will mean that wherever that reference is copied within the worksheet, it will always reference the same row or column.

Whenever you reference a cell, you have four options that determine what happens when that cell is copied elsewhere in the workbook. Let’s assume a formula in cell A1 is referencing cell C1, and that A1 is then copied into cell B2. Below is the behaviour based on different references to C1.

=C1

  • If A1 is copied into B2, then the formula in cell B2 will reference cell D2 instead of C1
  • The entire cell reference floats and moves around as it is copied
  • This is the most common type of cell reference. Either there is no intention to copy it elsewhere, or where it is being copied, it’s important that it always refers to the cell two cells to its right

=$C1

  • If A1 is copied into B2, then the formula in cell B2 will reference cell C2 instead of C1
  • The column reference is fixed by the $, but the row reference floats, and moves around as it is copied
  • Wherever this formula is copied, it will always refer to column C, but the row reference will vary depending on where you copy it to
  • This is useful if you always want a formula to refer to a unit price column, for example, but have several columns that calculate the annual price

=C$1

  • If A1 is copied into B2, then B2 will reference cell D1
  • The column reference floats, and moves around as it is copied, but the row reference is fixed by the $
  • This is the same as the previous example, but locks the row instead of the column

=$C$1

  • If A1 is copied into B2, then B2 will reference cell C1
  • The entire cell reference is locked, wherever the formula is copied in the worksheet
  • This is useful when referring to a static value such as an exchange rate or an overall unit cost

Excel makes it easy to toggle between the four values above in creating your formulae. When you're in the middle of entering a formula, put the cell reference in the formula, either by clicking the cell itself or typing its reference. Once you've done this, repeatedly tapping F4 will toggle between the four options above. It's handy and quick.

If you need any help, get in touch and I'll try to help.

Formula fundamentals

If you're new to formulae, or are keen to get your toes wet, here are a few tips to get you started.

Every formula should start with an = sign.

=A1+B2

=MAX($A:$A)

Beyond basic arithmetic, every formula has a standard syntax:

=FORMULA(ARGUMENTS)

FORMULA is the name of the formula being used; ARGUMENTS are a set of one or more conditions, references or values, depending on the formula being used. The arguments are always encased in round brackets.

Next up: text. Text references must always be contained within double-quotes. References to numbers should not be contained in quotes, nor should cell references, nor the names of the formulae themselves.

=IF(A1="New York","Yes",5)

This formula will check whether cell A1 contains the text "New York". If it does, then it will return the text "Yes". If not, it will return the number 5. The IF formula is not encased within quotes, nor is the number 5. But New York and Yes are both snippets of text, so they need to be wrapped in quotes.

Formulae are made up of arguments, and each pair of arguments is separated with a comma. Traditionally, you weren't allowed to put a space in a formula (unless it was part of a text string, as with New York above). More recent versions allow you to put a space after each comma, mainly to make them more readable. Purists might sneer at this. But if it helps you, then do it.

Most formulae involve references to other cells in the workbook. If you don't specify which sheet the cell reference refers to, then it defaults to refer to the cell within the sheet in which the formula has been written. So if you're in Sheet1 and refer to B25, then this will refer to cell B25 within Sheet1. But there's also a way of referencing cells in other sheets.

Sheet2!B9: this will refer to cell B9 within the worksheet named Sheet2

'Business Analysis'!B9: this will refer to cell B9 within the worksheet named Business Analysis

The latter example above demands single quotes around the sheet name because the sheet title contains a space. Without them, Excel would get confused. Put an exclamation mark after the sheet reference and follow it immediately with the cell reference.

If you have any trouble, get in touch and I'll try to help you out.

Olympic ticket allocation spreadsheet: explained

Yesterday, a friend and a Twitter follower (two separate people) asked me to put together a spreadsheet to figure out which Olympics tickets they might have been allocated based on the amount of money that would, they hoped, shortly be whizzing its way out of their respective bank accounts.

So I did. First, I produced a throwaway spreadsheet for Simon. I then went about creating something a bit more strategic.

To make the spreadsheet manageable, I allowed for up to 15 sets of tickets. My understanding is that if you requested four tickets to the Opening Ceremony, you either get them all or you get none.

Fifteen sets of tickets gives 2^15 combinations of tickets offered. Or 32,768.

First, the user confirms how many sets of tickets they requested.
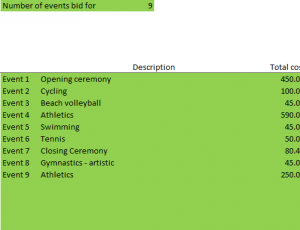


The event numbers down the left-hand side are stored as numbers (1–15). There are two features here. First, they all have the following custom number format:

"Event "0

This means that the number can be used in calculations, comparisons etc., but it shows after the word "Event". It's a handy tool.

Also, you'll notice that only the first nine events have event numbers. The cells below Event 9 do contain numbers. But conditional formatting compares them to the number of events entered at the top. If the number is higher than the number of events for which you've requested tickets, then the number is given the following number format:

;;;

The triple-semicolon is a means of hiding the contents of a cell (irrespective of its background colour) while at the same time storing a value therein for calculation and logic purposes. Again, handy.

Next, on a second sheet, I had to come up with all 32,768 permutations of tickets being awarded. First, I listed each of the 15 events across the top (listed in reverse order, from 15 to 1). I then created 32,768 rows below, each cell containing a 0 (representing not being awarded that set of tickets) or a 1 (representing being awarded tickets for that event).

With the ticket prices listed across the top in row 2, the following formula was used to establish how much that ticket combination would cost.

=IF(ROW(C3)-2<=2^Bid!$E$1,SUMPRODUCT(C3:Q3,$C$2:$Q$2)+6,"N/A")

The IF statement establishes whether the row in question is valid based on the number of ticket sets selected. For example, if I've ordered four sets, only the first 16 combinations are relevant.

The SUMPRODUCT function takes equally-sized ranges, multiplies together each set of corresponding values and adds these results up. Here, it's multiplying the range of zeros and ones for that row with the corresponding ticket costs. The dollars before the row numbers for the costs mean that when you copy the formulae down, the reference to row 2 holds firm.

Finally, the +6 adds £6, the one-off cost of postage associated with the order. (Criminal!)

Each of these results is then compared with the amount of money taken out of your account, and the exact matches are flagged and numbered.

Off to the right of the event data mentioned above, there are 30 thin columns labelled Scenario 1 to Scenario 30. They represent up to 30 ticket allocation combinations, hopefully sufficient. Again, the titles are stored as numbers and conditional formatting hides the redundant ones.
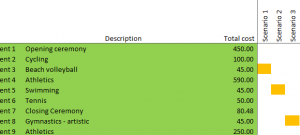
A VLOOKUP is used to bring back the zeros and ones associated with each winning scenario, and conditional formatting hides the zeros (you haven't been awarded that set of tickets) and colours the ones orange (you've been awarded that set).

Hope you like it. Here's the link again.
Toggling between values and formulae

For most people, the only way to see the formula in a cell is to click on the cell. You can then see the formula in the bar immediately below the ribbon. Hit F2 and you can start editing that formula.

But there's a little-known way of seeing all formulae across the entire sheet at the same time. And it uses the mysterious key above the Tab key on most keyboards, to the left of the 1 key—the one that you've probably never touched.

If you hit CTRL and that key, then instead of showing the cells' values, the spreadsheet will display the formulae therein. Repeat the action and it will revert to the values.

It can be hugely useful when you need to audit things and generally figure out what's going on. (But don't tell anyone. Keep it up your sleeve.)