
Statistics
In: Examples

What’s in the Basket of Goods? 80 years of shopping history
The Visual.ONS site is full of interesting visualisations and interactive stories based on National Statistics. Here’s a neat timeline showing … Read more » – What’s in the Basket of Goods? 80 years of shopping history
In: Examples
ONS to host AMA (Ask Me Anything) on Reddit
The Office for National Statistics is taking questions on any topic as part of the ‘Ask Me Anything’ theme on … Read more » – ONS to host AMA (Ask Me Anything) on Reddit
In: Strategies
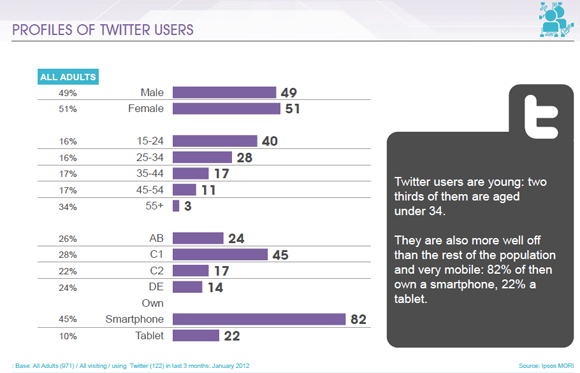
Profiling data on social network users: The Wall Blog
Robust UK market research figures from Ipsos MORI on the profile of users of the main social networks, from January … Read more » – Profiling data on social network users: The Wall Blog
In: Questions
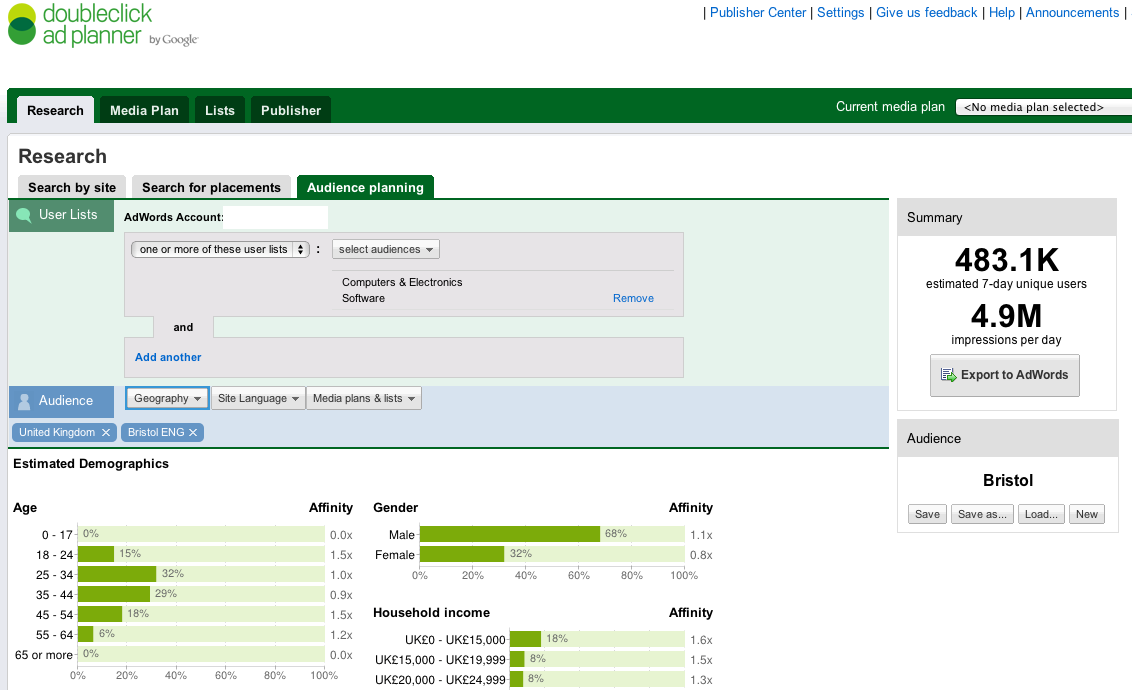
Estimating social media use within a geographic area
Mark Braggins asks: “I am trying to determine the level of social media use at a local level . I’m … Read more » – Estimating social media use within a geographic area
In: Examples

Sickness absence animated presentation: ONS
The Office for National Statistics have been using YouTube to present animated versions of their general-interest statistical reports, with a … Read more » – Sickness absence animated presentation: ONS
In: Examples
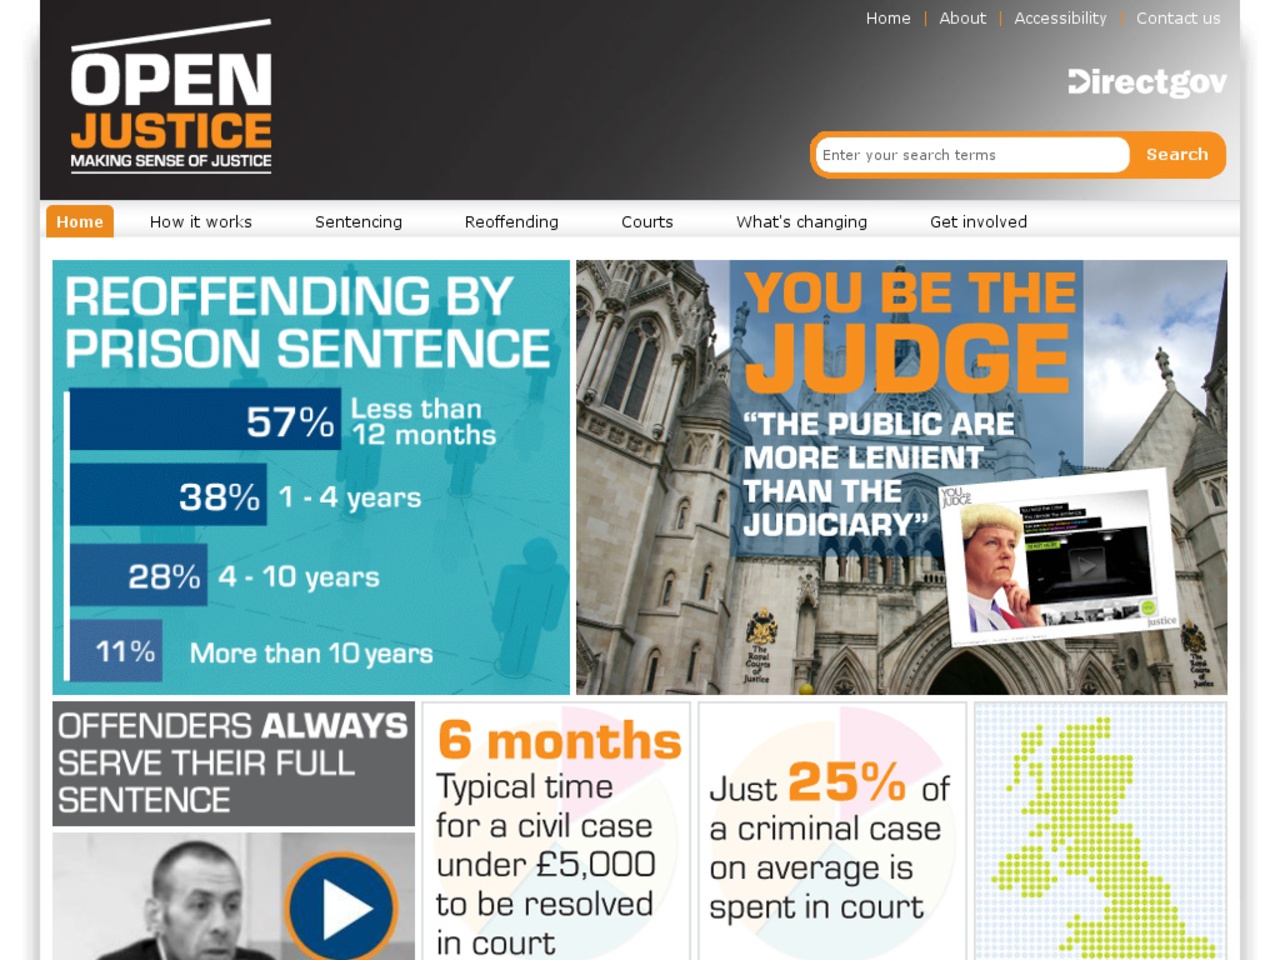
Open Justice – Making Sense of Justice
By publishing information in more accessible way, Open Justice aims to give members of the public the opportunity to see … Read more » – Open Justice – Making Sense of Justice
In: Strategies
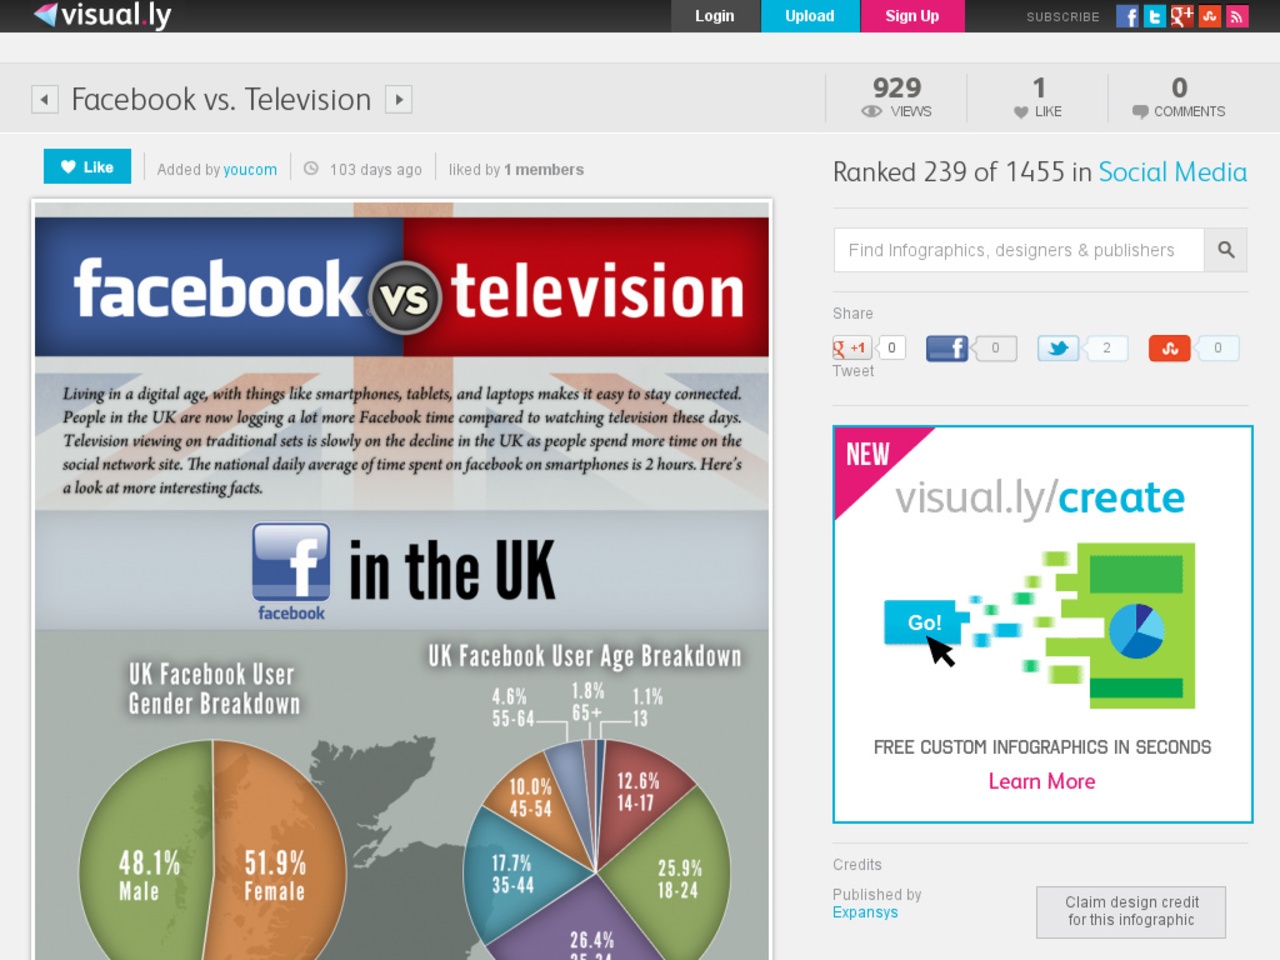
Facebook vs. Television infographic
An infographic is a useful way to get across really complex information. This one helps set the scene for Facebook … Read more » – Facebook vs. Television infographic
 Everything