
Data
In: Examples
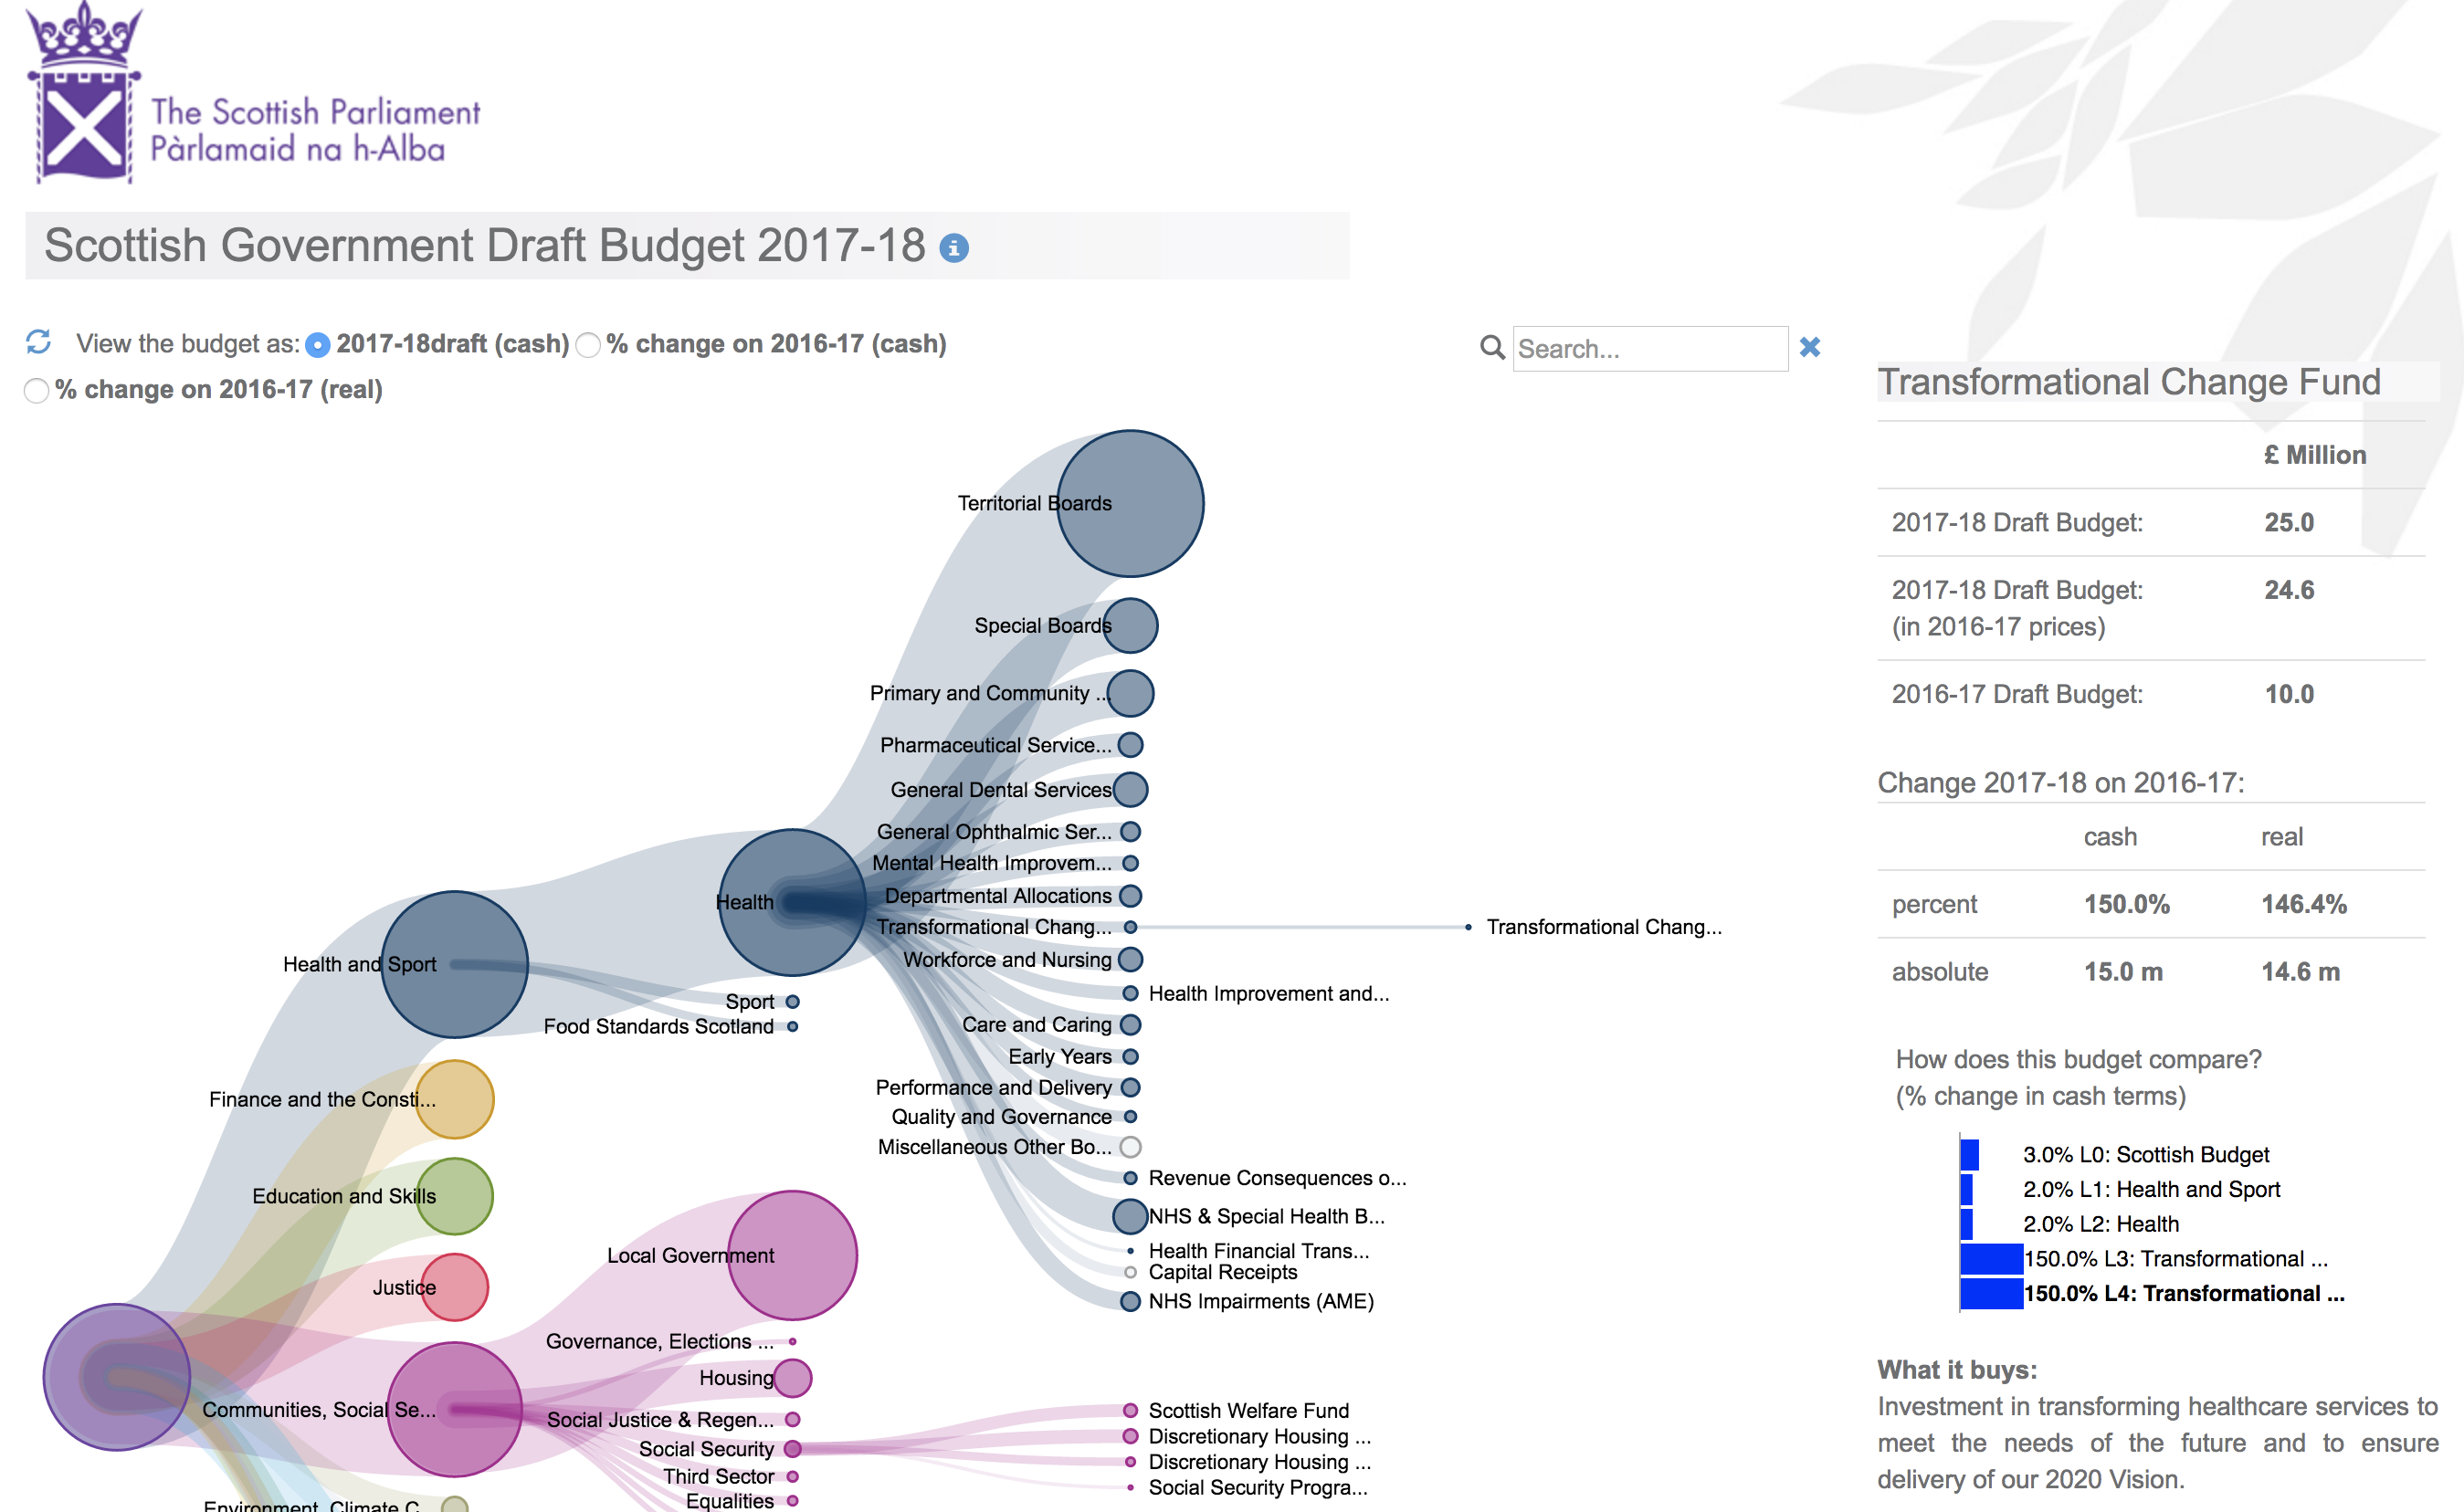
Scottish Government Budget – interactive infographic
Impressive tool from the Scottish Parliament showing how various aspects of public spending are proposed to increase/decrease: The Scottish Budget … Read more » – Scottish Government Budget – interactive infographic
In: Questions
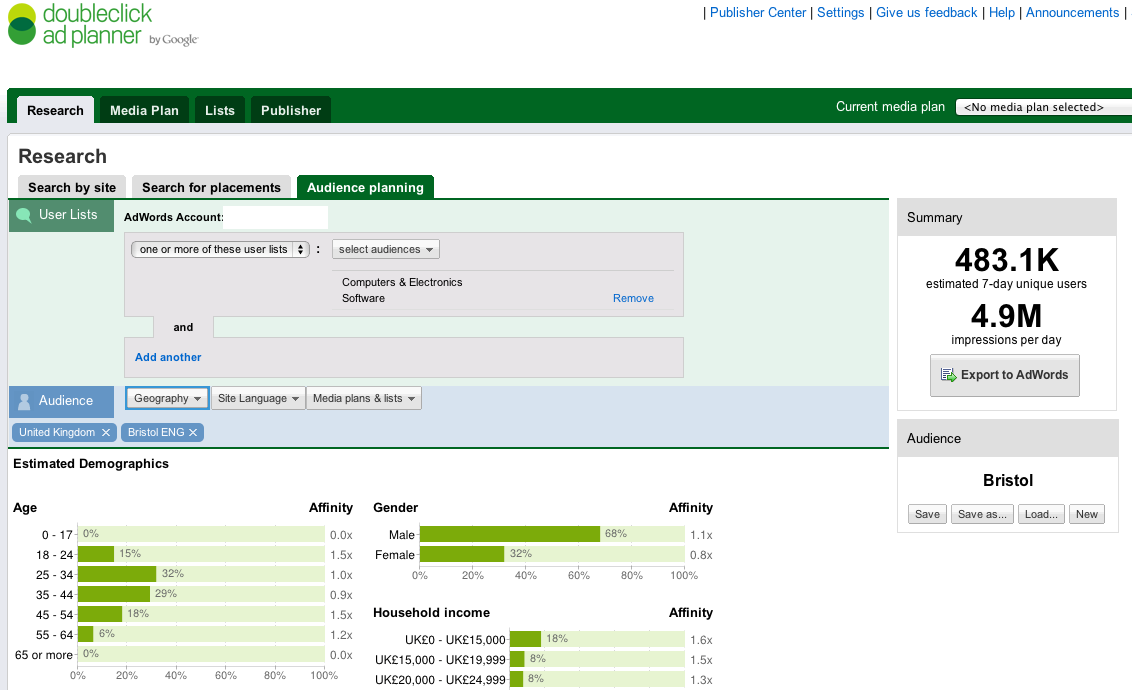
Estimating social media use within a geographic area
Mark Braggins asks: “I am trying to determine the level of social media use at a local level . I’m … Read more » – Estimating social media use within a geographic area
In: Techniques
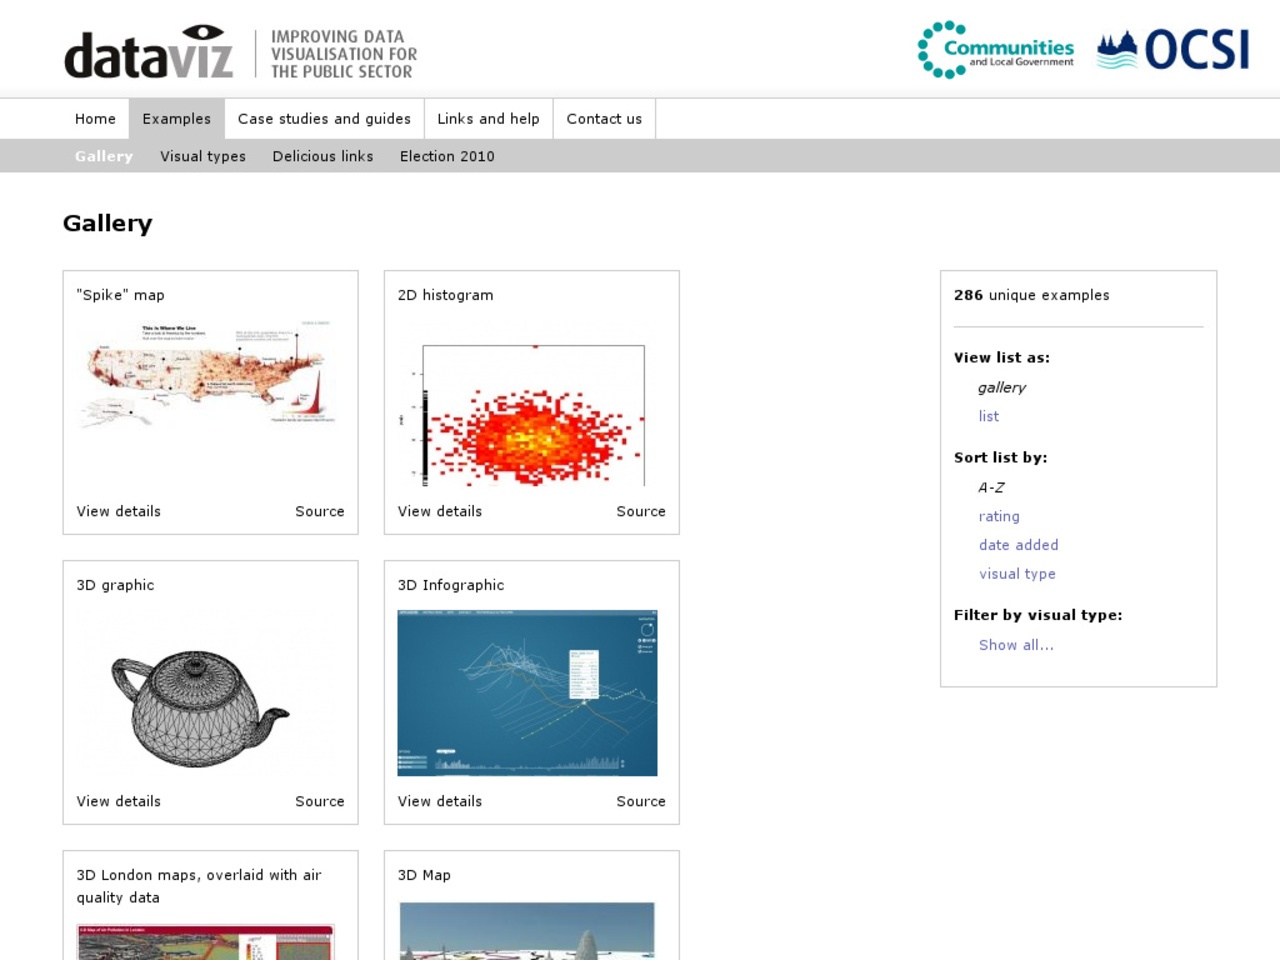
Improving visualisation: infographics and more
The Improving Data Visualisation site from OCSI (supported by CLG) is a great resource of tools, examples and ideas for … Read more » – Improving visualisation: infographics and more
In: Examples
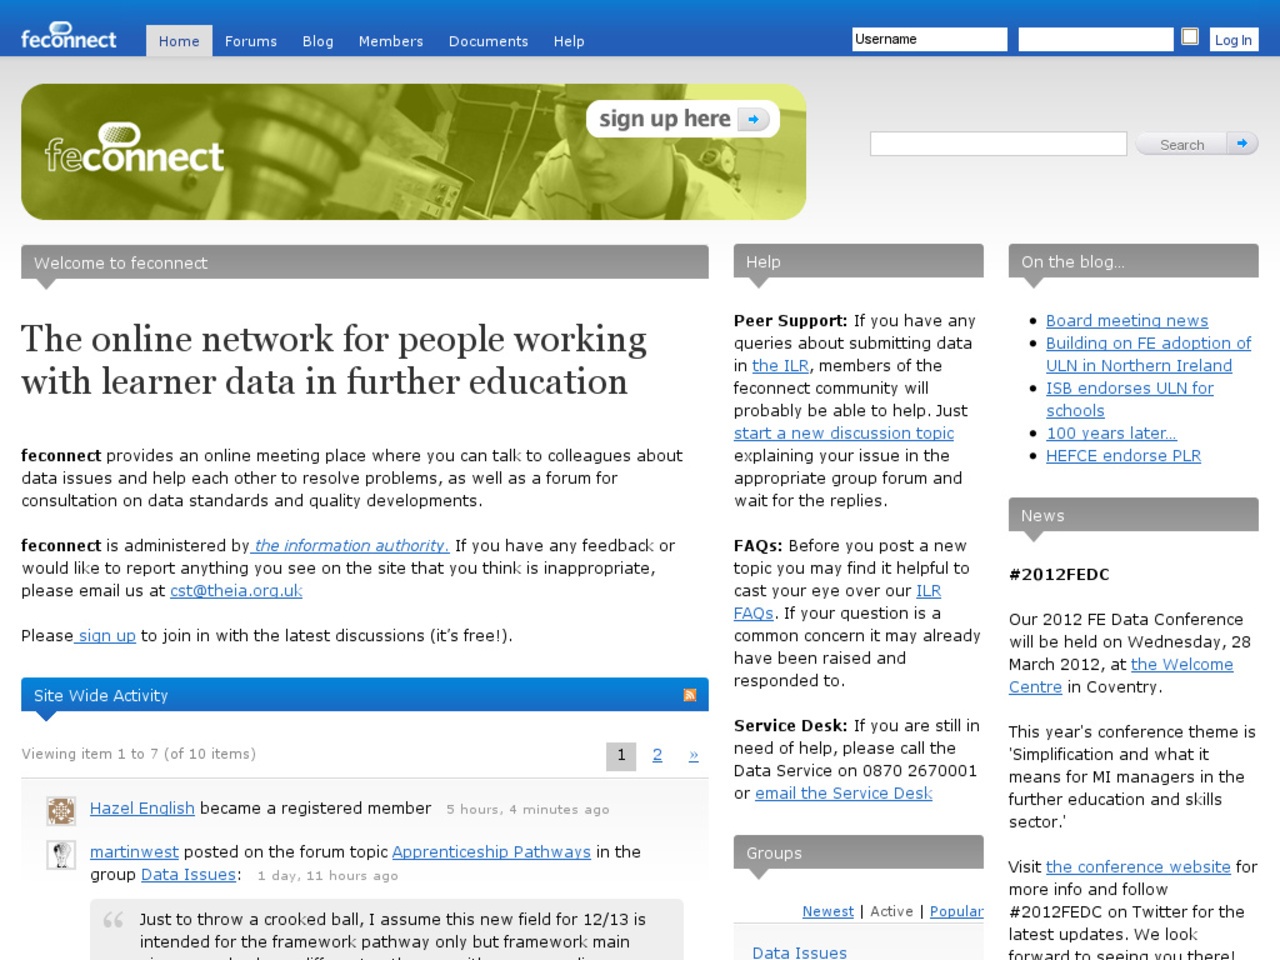
Feconnect
A community forum site for data developers and managers in the further education sector: Welcome to feconnect – the online … Read more » – Feconnect
 Everything